

LTV / CAC as a measure of value generated
LTV / CAC or other similar measures are increasingly being used in the insurance industry as a measure of value generated, especially among the insurtechs. We applaud this move to a substantially more sophisticated measure, but also note some downsides.
Executive Summary: The LTV / CAC measure is common among SaaS, but has additional complications when applied to insurance products, including different switching mechanisms and customer dynamics. While the measure demonstrates value much better than loss ratio, we model some of the complexities that make its use tricky and potentially misleading.
Intro: For P/C insurers measuring profitability and business performance, the conversation has long revolved around loss (or combined) ratio measurements. Loss ratio is a good first step, being simple and well-understood. However, the LTV / CAC calculation captures significantly more information, especially for a non-risk entity (MGA or lead wholesaler, for example) where loss ratio may not link directly to value. We highlight the risk of mis-measurement, and additional complications compared to using the LTV / CAC calculation in the SaaS space.
Defining the measure: We first define the measure. Appendix 1 includes some examples of LTV calculations for certain companies defined in public disclosures.
LTV / CAC = [ Annual Revenue x Gross Margin x Expected Duration ] / Acquisition Cost
This can be calculated on an aggregate, segment, or individual policyholder basis. Most disclosures of LTV / CAC are on an aggregated basis, but product management is measured more granularly. We calculate this on an annual basis, although the measure could be calculated using whatever timescale is desired – measuring duration in years is common and makes the discussion easier.
Gross Margin is defined slightly differently for each company, but the textbook definition is net sales minus cost of goods sold, and in the insurance context this roughly translates to
Gross Margin = Written Premium + Fees – Expected Loss and LAE
Expected Duration is how long the company expects to collect the margin and is often approximated as 1 / (Cancel Rate) or 1 / (1 - Retention Rate).
Acquisition Cost is the total cost to acquire the business, and can look significantly different across companies – for a company with a national media presence and captive agents (ex: Allstate), it consists of media spending and agent commissions; for a company buying leads from internet providers, it’s the cost of leads and a call center.
Pros and cons: We mostly look at the LTV / CAC measure as a comparison to loss ratio, which is the long-standing standard measure of profitability in insurance.
Loss ratio is more common, easier to compare across companies, and intuitively simpler to understand. LTV / CAC is much more complicated, but that complexity is a result of capturing more information. The primary downside is that LTV / CAC is much more difficult to estimate and the uncertainty associated with the measure can create wide differences between expected and actual results.
The loss ratio calculation is well-defined and can be reconciled to GAAP or stat financials, providing a feedback loop if management mis-estimates the measure, whether accidental or with intent. Any under-estimation of the loss ratio will be recognized relatively soon with the booking of adverse development on prior years’ losses. But Retention, as we show below, can take many years to materialize, and has no comparison within GAAP or stat accounting to enable a reconciliation.
Using LTV / CAC is common in many technology businesses, so it is more commonly understood by investors and management outside the insurance space, especially for early-stage growth businesses.
We note that both loss ratio and LTV / CAC exclude corporate overhead costs like management, licensing, etc. As a result, a LTV / CAC > 1.00 (or combined ratio < 100%) implies a profit on the marginal customer, but the company still needs to scale up to a point that overhead costs do not overwhelm the value creation measured by the LTV / CAC or loss ratio.
Our aggregate view on LTV / CAC is that it captures valuable information better than a simple loss ratio measure, and companies should be paying attention to the measure, even if they are not a startup. Additionally, it takes a more long-term view of the value of the enterprise than a loss ratio measure. But it is important to also be aware of weaknesses and opportunities to mislead, which we explore below.
Model: We create a simple model for calculating LTV / CAC for an insurer, and use that as our baseline for discussing the underlying data and assumptions:
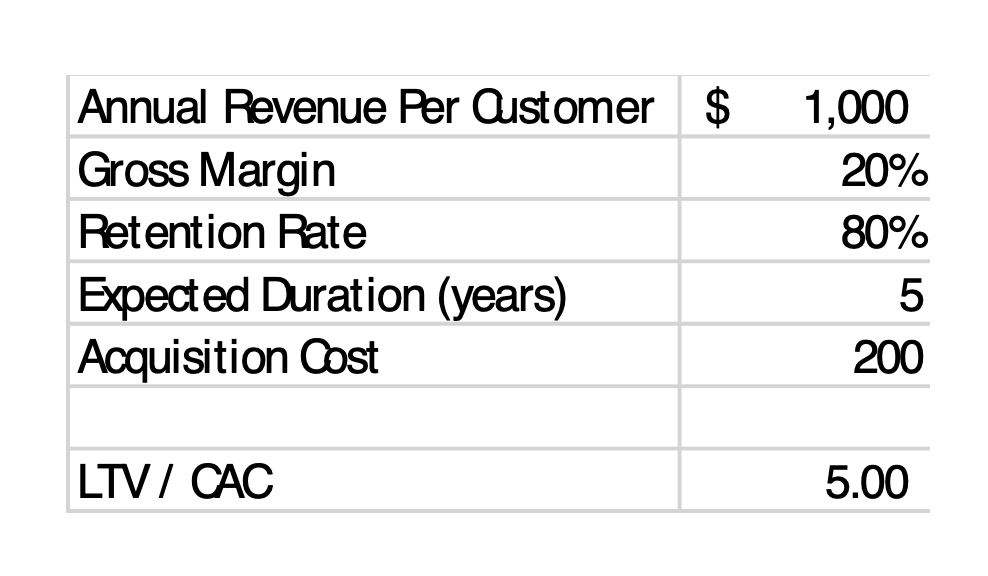
Annual Revenue Per Customer
This amount is very easy to calculate and hard to falsify, although there are certain judgments that need to be considered, such as defining a customer – generally a family buying a single policy would be a single customer, and an individual or business buying multiple policies would also be a single customer, although circumstances can dictate a different answer at times.
Gross Margin
In general, Gross Margin = 1 – loss (and LAE) ratio, and most insurers will base this on their current pricing model. The variability in this is the same as that of the traditional measure of insurer profitability, but with the additional complexity that the LTV / CAC calculation requires a view on change in loss ratio over the lifecycle of the policyholders.
With large insurers’ stable books often seeing a movement of 5 or more loss ratio points from pricing to initial booked loss to ultimate booked loss, that same swing exists within the LTV / CAC calculation:
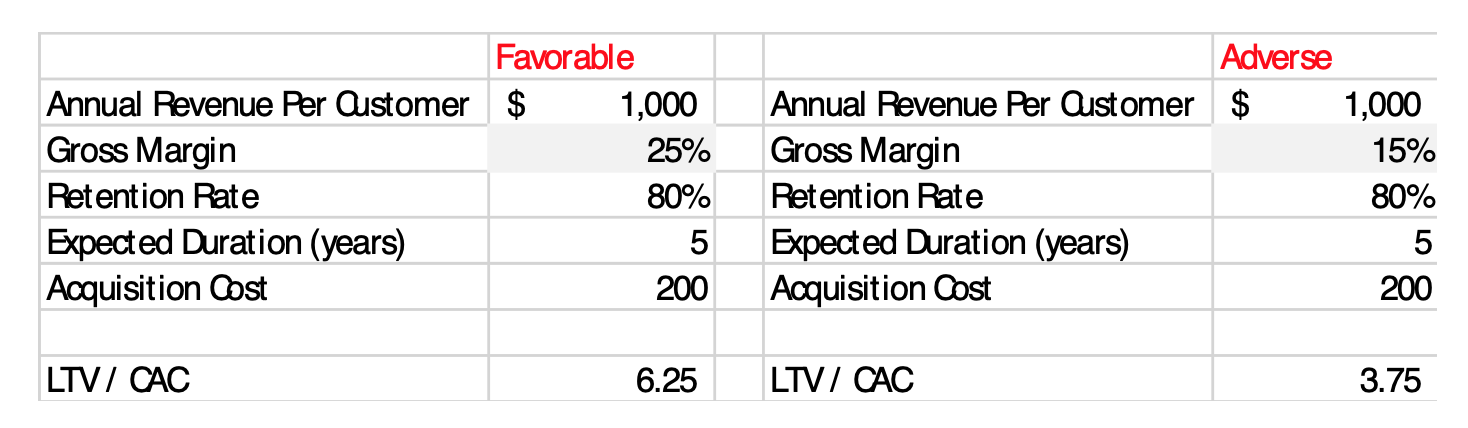
Obviously, for a startup insurer, the difficulty in estimating is higher, as is the overall variability - it can take several years to develop a stable book of business, meaning the potential variability can be much higher. Most lines of business will see a loss ratio higher when writing new business, so (similar to Retention, which we address below), the loss ratio (and by implication, Gross Margin) will not be a single number, but an evolving amount over time.
The interplay between Gross Margin and Retention Rate is significant, and develops over time, as management decisions on product and pricing impact both simultaneously.
Retention Rate / Duration
This is by far the most uncertain and actuarial of the assumptions.
The first issue with Retention is that it is often expressed as a single number, but actually varies over the policy lifecycle. And this is then intertwined with the measurement issue, where Retention is normally measured (and disclosed) as a measure in the current period, but the calculation of LTV would best be measured as a series of Retentions over time.
Most LOBs we have seen will have lower retention early on, rising over time as the high-churn policies move on and the most stable policyholders remain. In Appendix 2, we look at a sample of real-world patterns that were available as reference. The tricky part is the estimation of the tail of the pattern in a start-up environment.
Below we show a hypothetical scenario, that is consistent with real-world experience. We take 100 policies during the initial period, with a first-year retention of 70%, which rises to 95% retention after five years. Running this scenario out many years would leave a total of about 900 policy periods, or an average duration of 9 years; implying that a steady-state book of this business would show a retention of about 90%.

Mathematical note: the calculation works out to 938 policy periods if modeled out for a hypothetical 100 years, or an average duration of 9.38 periods per policyholder. This then equates to an average Retention of 89% = 1 – 1 / 9.38. The same value could be estimated by weighting together the number of policies times their incremental Retention: 100 x 0.70, 70 x 0.75, 53 x 0.80, etc.
It would take four years before any of the business would reach 90%, leaving a lot of opportunity for the company to underestimate the retention during the start-up phase. And, an initial measure of 70% during the first year would have a substantial impact on the LTV / CAC calculation:

A William Blair research report from May 2021 cites Retentions of 83-95% among traditional insurers and 58-77% for insurtechs, so the variability is substantial and would result in a large swing in LTV / CAC (using our hypothetical baseline for other assumptions):
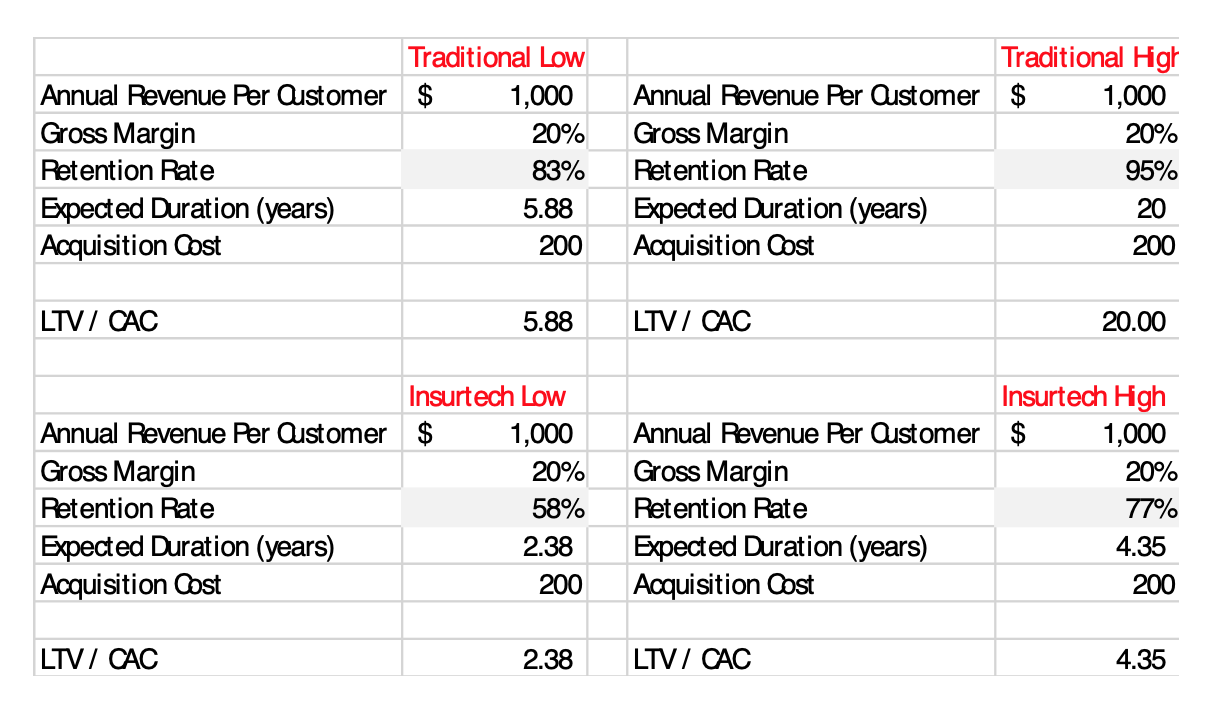
We would assume that the insurtech Retention numbers will increase as their books mature, but of course that is driven by more than just a maturing book, other drivers include business models and customer service.
Customer Acquisition Cost
This could be a simple calculation, but can also be deceptively tricky in some cases. One concern is if management intentionally under-priced business in order to move toward scale early on. This can be reflected in a higher loss ratio (lower, or possibly initially negative, Gross Margin) as losses are taken to build experience. Should the higher loss ratio be reflected in the Gross Margin or Acquisition Cost? Either is reasonable, but of course from a measurement standpoint, the concern is that it is not reflected at all. And taking an optimistic view on pricing/reserving and ignoring the costs is not sustainable long-term.
Embedded in the Acquisition Cost (or otherwise accounted for as part of the Retention assumptions) should be the reality that some effort is required even after a customer is acquired – questions, endorsements, or efforts to follow-up with customers and increase retention all have associated costs.
If a company is retaining the risk, then a marginal contribution to surplus would be an additional cost of acquiring a customer.
The overall assumptions will also need to be calibrated for policyholders that lapse and return – which can be shown in the Retention assumptions or the CAC, or both.